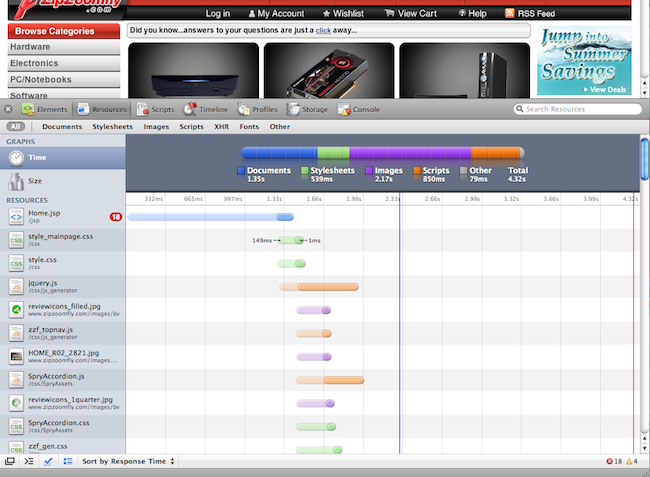
With widely use of Ajax and Javascript in presentation tier of application these 2 years, it's getting hard to find where the real problem is in web application. Before you the only thing you have to care about is server side, now client browser side makes big deal. one incidence in my career life, i got a issue ticket reporting that customer experienced web site slow. I checked each application/web server, database, networking and everything on server side, ( it's especially hard in clustered environment , since you have you check every individual server) and couldn't find any problem. 3 hours had past, and i have no clue. Suddenly it occurred to me that Safari got resource tracking tool. Chrome got same tool build-in. I ran the resource tracking on website and suddenly everything is so clear. it's Google Analytics causing all those trouble. Google Analytics uses javascript to call or fetched resource on google server and it turned out one of resources that this Google Analytics javascript tried to fetch is not available and all those javascript is running on client browser, so i can't find anything wrong on our server. following are some quick tip to show you how to determine performance in really quick way.
First, open the page you want to inspect , and right click. Choose "inspect element" on menu.

it will now bring out a new spitted frame in the bottom. got to "Resources" tab. you will find a pretty chart including all resources rendered by browser on this page.

if you separate web-server and web-application server in architecture, you can easily tell which server takes more time to response from resource type


No comments:
Post a Comment